Trends
Trends
JUL
12
2022
Opinion
The value of data and analytics
How ericsson’s mobility report has become the industry’s benchmark report
Ten years ago, leveraging the vast quantity and quality of data on the performance of its products and networks, Ericsson decided to share its analysis of the available information to try to anticipate trends and measure the health of the telecommunications sector.
Initially, data collection and analysis were shared internally to define development strategy and strategic planning, and so far, so typical. But the marketing and communications teams realised the value of using data analysis to publicise critical trends and disruptive events in the telecoms industry in a ground-breaking decision that has made them a global trendsetter with thousands of subscribers worldwide.
Peter Jonsson, executive editor of the Ericsson Mobility Report, explains in an interview for Cellnex Trends the evolution of this crucial source of information for the sector, considered not only by the industry but also by analysts, journalists, business schools and universities as an essential publication on the health and projections of the omnipresent telecommunications market.
From the vantage point of business intelligence analysis, our interviewee was at the origin of the quarterly report, which, in the first week of publication, is the subject of 4,000 web downloads and more than 10,000 web visits and is replicated by hundreds of media outlets around the world.
CT: How did the idea come about? Why did you decide to share your reports with the rest of the industry, the media and society?
PJ: Like most engineering companies, we had a lot of performance data about our products, solutions and networks through our partnerships with customers in 180 countries. Furthermore, we did a lot of equipment and market forecasts to thoroughly understand how the mobile industry is evolving in the coming years. Historically, this data was retrieved and analysed primarily for input to our development units and strategic business planning. Knowledge and insights retrieved from it were not widely spread within Ericsson and only occasionally on an ad-hoc basis communicated externally. In the marketing and communications department, a small team thought we should make some of these abundant data sets more widely available internally and externally to align Ericsson’s communication about how we view the industry development. For some time, we had discussed that although we tracked a lot of data related to traffic and subscription uptake for mobile broadband, it wasn’t well known internally and not externally. So, with great ambition, we published the first report in November 2011 with the idea of “establishing Ericsson as the industry’s leading source of information” and becoming “a must-have publication for operators and analysts worldwide”.
CT: How has the publication evolved over the years?
PJ: We have always had the ambition to evolve and improve the publication for each edition. In just a few years, we turned Ericsson Mobility Report from “just a report” into a “channel” communicating with the market, transforming it from being newsworthy to trustworthy. As a result of our ambition and efforts, Ericsson Mobility report has received numerous international awards in recent years.
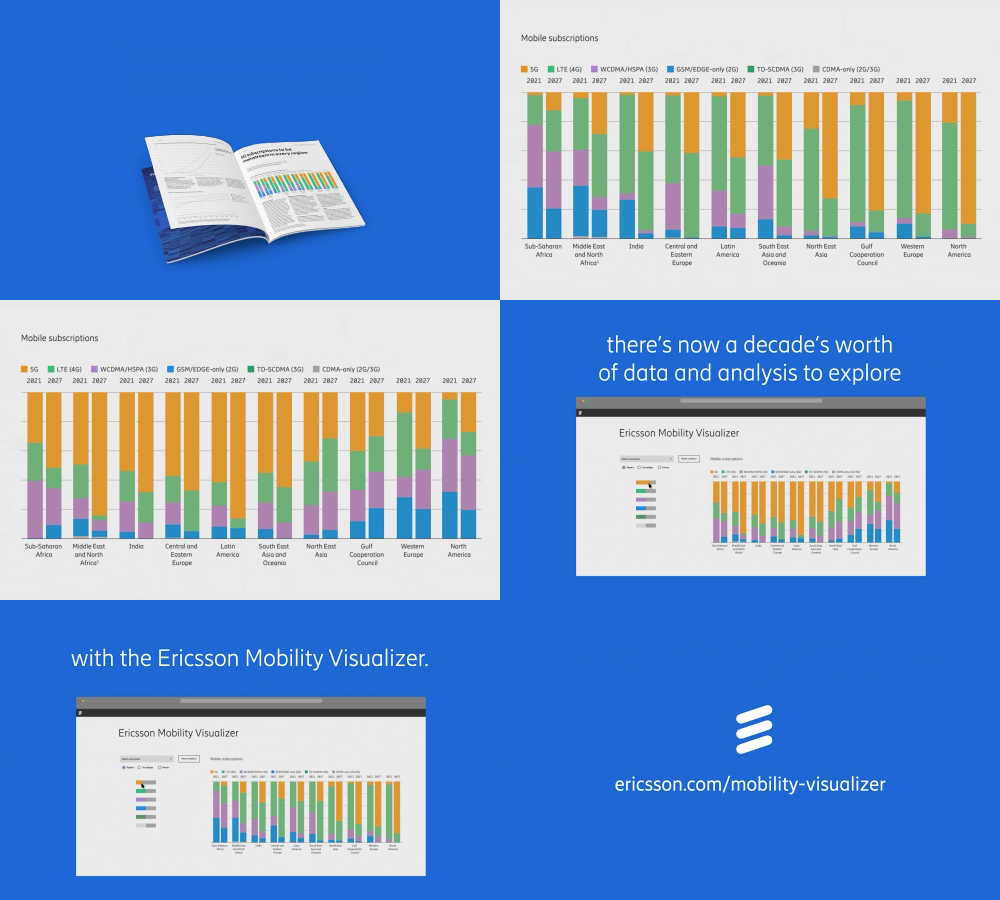
Practically every year, we have introduced new forecasts or more granular forecasts in the report. Since 2015 we have been producing regional reports and IoT forecasts, and in 2016 we started to do co-written articles with service providers. In 2018 we created two interactive web applications expanding the scope and data sets of the published report. The Ericsson Mobility Visualizer is accessible to anyone interested in mobile industry development, where the user can explore actual and forecast data from the Mobility Report. It contains thousands of data points for a wide range of data types, including mobile subscriptions, mobile broadband subscriptions, mobile data traffic, traffic per application type, VoLTE statistics, monthly data usage per device and an IoT-connected device forecast. Anyone in media wanting to explore and use the data to build their charts can export data and generate graphs for its publications. The other tool, Ericsson Mobility Calculator, allows users to explore the relationship between the usage of various app types and monthly traffic per subscription. The application enables the user to estimate the traffic impact of different applications, including streaming multiple video resolutions and immersive video formats, such as VR 360-degree video, gaming, AR, etc.
CT: What have been the main milestones and lessons learned from this experience, and what remains of the first traffic data report?
PJ: Some learnings; never stop thinking about the different target groups when writing feature articles; make it easy and exciting for your readers to take part in forecast and article findings; never compromise with the quality; double-check the numbers and logic of article stories. Support your thesis and statements throughout the report with relevant data sets. Offer a “smorgasbord” of interesting article topics to cater for different target groups but stay fact-oriented rather than speculative when presenting your findings related to a specific topic. Finally, strive for an outside-in perspective on your stories.
From the first traffic data report, we still have a set of basic, same forecast types regarding subscriptions and traffic outlook for the coming six-year. But we have extended with new ones and improved the design of the pages for improved readability, as well as added more insights to the data sets compared to the first edition in 2011
CT Based on the elements of analysis you have carried out over the years. What are the main trends that will develop in the coming years?
PJ: Communication is a basic human need and will only grow in importance over the coming years. We will continue to see more things being connected in the future as the Internet of Things matures and become even more spread among consumers and businesses. 5G network will open up new ways of communicating between humans and machines,
CT: The relevance of the Ericsson Mobility Report is unquestionable today. Both from the media’s and industry analysts’ and companies’ points of view. How do you value it?
PJ: It is enriching for us to see the increase in the number of downloads of the report, the rise in web page views with every edition we publish and the positive feedback from customers and analysts about the content. Ericsson needs to share our projections and insights with analysts, media and companies to open up for a dialogue about where our industry is heading. We don´t claim to have all the answers but are happy to share our knowledge and view on industry development.
CT: Everything you do, even specific articles, is based on data, avoiding opinions or industry siren songs. To what extent do you think this supports your credibility? Tell us about the methodology of the report.
PJ: Yes, it is very accurate how you describe it. This report aims to publicly share analysis based on mobile traffic measurements, a selection of data from Ericsson strategic forecasts, consumer research, co-written articles with service providers and other relevant studies to provide insights into the current mobile industry traffic and market trends. The content should be based on primary data from Ericsson proprietary sources, complemented by external data sources as a reference when applicable. We want to put facts and figures at the centre without distorting our readers’ vision with qualifiers.
CT: Can you give us insight into the report’s use/impact/scope?
PJ: We typically have 3,000-4,000 report downloads (pdf) from our website and more than 10,000 page views on our website just during the first week after publication, and then it just continues for several months after launch. Hundreds of tier-1 media related to business, industry and finance across the globe typically bring up critical insights from our issued press release with every report release. We have seen our forecast referenced in EU discussions and many telecom regulatory bodies’ discussions. The EMR has been used by Academia (universities, institutes, etc.) to illustrate or underpin an academic article on different subjects where mobility and communications are essential factors. A couple of years back, we found out the Ericsson Mobility Report and its content was used as part course literature in MBA programs at two universities in the U.S.
CT: What have been the most disruptive elements in the sector over the last ten years?
PJ: That the smartphone became the primary device for accessing the internet. Ten years ago most market drivers pointed the PC to become the most mobile-connected device, but that did not materialize. Instead, smartphone subscriptions have increased from 720 million in 2011 to 6,340 million in 2021. During the same period, the data traffic volume in the world´s mobile networks increased by 300. One key learning is that once a mobile standard becomes global and reaches significant population coverage, and the ecosystem around it is established, the uptake towards mass market can be faster than even the most optimistic hockey-stick forecasts indicate.


